Measuring Impact: Applying User-Perceived Value Data Collection to Solar Appliances
Efficiency for Access launched the ‘Impact Assessment Framework for High-Performing Appliances’ to enhance industry-wide assessment, measurement and reporting of the impact of solar appliances

Impact Assessment Framework for Off-Grid Appliances
Solar-powered fans, refrigerators, TVs and water pumps can enable families in Sub-Saharan Africa and India to stay cool, connected and keep food and water fresh. Gaining access to these can be lifechanging. For organisations working to improve access to or sell appliances, it can be challenging to measure the impact that the users perceive. To this end, Efficiency for Access launched the ‘Impact Assessment Framework for High-Performing Appliances’. This framework seeks to enhance industry-wide assessment, measurement and reporting of the impact of solar appliances. The framework includes relevant stakeholders’ viewpoints, input from end-users in Uganda and India, and suggested impact indicators and metrics based on social, environmental, and economic factors.
Understanding solar-appliance user’s needs can help prioritise impact indicators. In short, programmes working to improve access to high-performing solar appliances can focus on impacts that support the social and economic development of appliance users. This can reduce biases when measuring impacts and outcomes of programme activities.
Filling the Data Gap
It is relatively straightforward to measure economic impacts from access to high-performing solar appliances compared with social and environmental impacts. For example, economic impacts can be determined by measuring:
- Money saved by reducing fuel costs
- Jobs created as a direct result of appliance ownership
- Increased sources of income created
- Increased annual income
In contrast, measuring social and environmental impacts can be complex for the following reasons:
- Social and environmental impacts are not immediately clear
- It is challenging to separate the role of specific interventions as there may be other contributing factors
Below, we explain how the framework can be utilised and simplify the measurement of social and environmental impacts.
User-Perceived Value (UPV) Data Collection
Beyond a comprehensive literature review, we engaged with two key stakeholders — those who will use the data and appliance users. Speaking directly with end-users enabled us to determine why they purchased appliances and the perceived impact that they had on their daily lives. We selected end-users from Uganda and India, two countries with existing appliance usage but contrasting contexts, Uganda being an early-stage market for off-grid appliances and India being well-developed, allowing for comparison. Participants were further filtered based on their knowledge of the target appliance(s).
The end-user research consisted of a UPV game and a socio-economic survey. The UPV game explored known and unknown impacts of appliances on users and non-users, while the socio-economic survey contextualised the data collected from the UPV game. In the general version of the UPV game, interviewees were asked to select five out of 45 presented items, rank them in order of importance for each item and explain why they chose them. This process is illustrated below.

In the appliance-specific version of the UPV game, only four cards were presented: TV, fan, refrigerator and water pump. The interviewees were then asked to rank the items in order of importance and explain the advantages and disadvantages of each.
Data science and natural language processing (NLP) is used to classify the interviewee’s feedback according to their perceived values, such as water security, and whether the sentence was positive, negative, or neutral (sentiment).
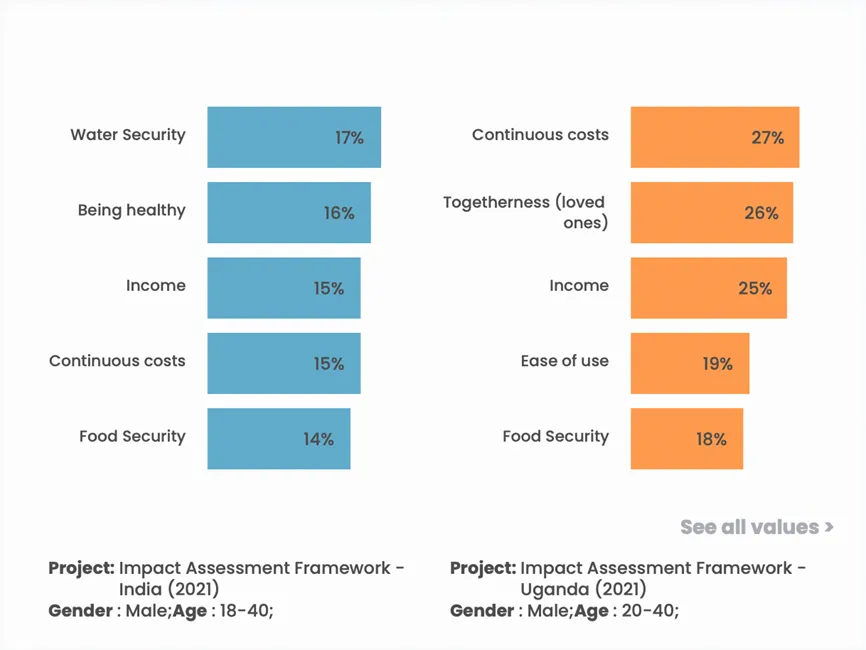
End-users from different regions have varying needs for the appliances, as can be seen in the graph below. For example, users in India use TVs as a source of information [UPV: ‘being informed’], while in Uganda, users reported TV’s most significant impact as helping to bring loved ones together [UPV: ‘togetherness (loved ones)’]. This information was used to quantify some social impacts and uncover other unforeseen impacts.

The final result includes an interactive dashboard with graphical outputs that can be embedded and manipulated into reports to provide a more holistic set of insights that the reader can examine. Below is a graph from the dashboard that illustrates the excerpts relating to fans selected by participants from India, commonly used words, their UPVs and sentiment.

Dashboard
The dashboard is a living database containing key end-user insights. An example of its application is understanding how users view the importance of the appliance. The information can be categorised by gender or age group.
Here’s a video outlining how to use the dashboard:
Survey
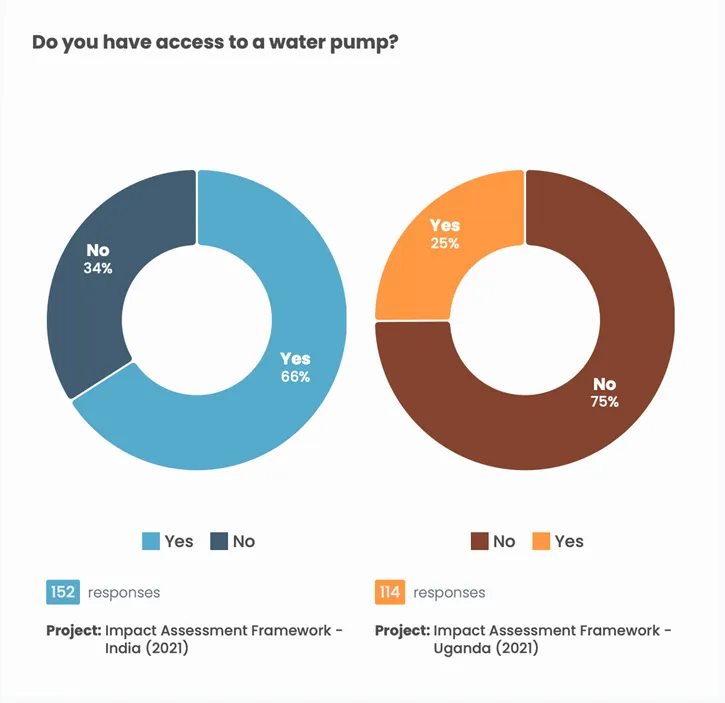
The dashboard also includes appliance specific questions, providing further insights on how users interact with appliances and how that can be improved. The graph below shows that while most users interviewed in India have solar water pumps which is not the case in Uganda. The graph also demonstrates that in both countries most users interviewed obtained their solar water pumps by paying cash.
Efficiency for Access worked with Rural Senses, an organisation which hosts a platform to build, promote and evaluate projects and products, on the Impact Assessment Framework for High-Performing Appliances. This project used the UPV method to inform its analysis, resulting in deeper insights into customers and consumers.
Take a look at the Impact Assessment Framework here to dive deeper.